· via Hacker News – Front Page (native)
AI sell-off is a mild S&P 500 correction but a Covid-sized crash for chip stocks
An analysis comparing the AI-driven market slide with past crashes finds the S&P 500 just 6% below its record, while US chip stocks are down 36% — as deep as their pandemic fall.
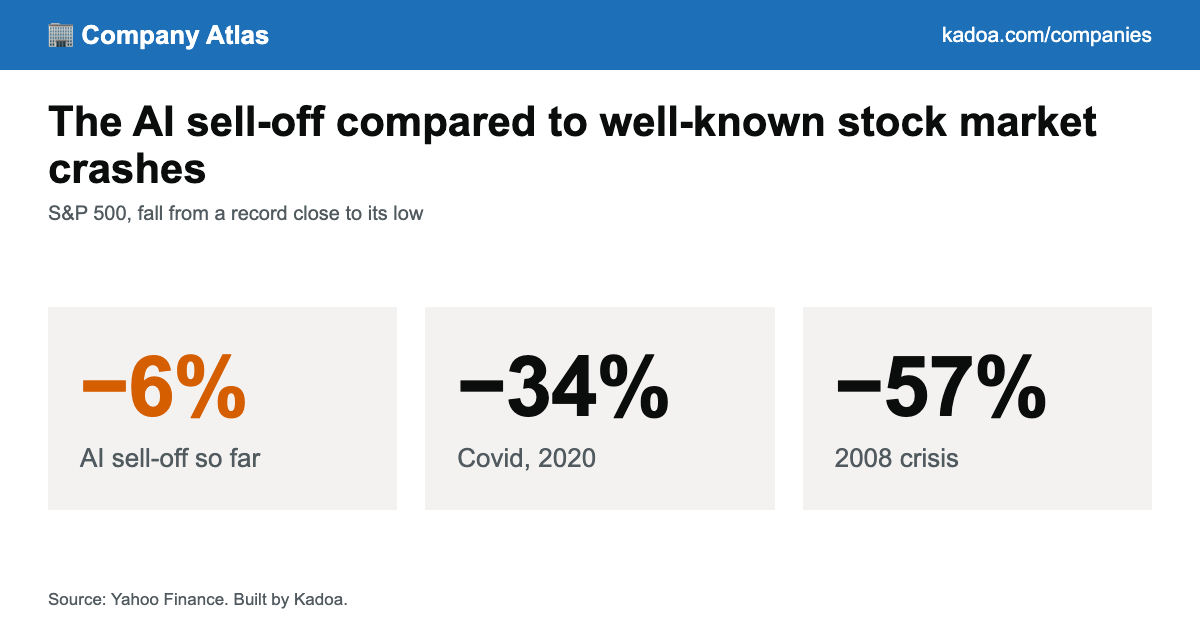
An analysis from Kadoa's Company Tracker sets the recent AI-driven market slide alongside the best-known crashes of the past century, and the verdict splits in two: for the broad US market the episode barely registers, while for semiconductor shares it already ranks among the deepest falls on record.
According to Kadoa, the S&P 500 closed on 6 November 2026 about 6% below the record it set on 6 October, a gap of 23 trading days. The sharpest single session came on 5 November, when the index lost 4.4%, its worst day since 4 April 2025. The tech-heavy Nasdaq is down roughly 11%. The heaviest damage is in chips: the PHLX Semiconductor index has fallen 36% from its 22 June peak, a drawdown Kadoa says matches its pandemic decline of 35%.
Mild by the broad market's standards
To put the fall in context, Kadoa counted every slide of 6% or more from a record close in the S&P 500 since 1928 — 56 in total. Only 16 of those went on to lose more than 15%, and just one in five of the 6% dips ever reached a 20% loss from the peak. On that record, the current drawdown is unremarkable so far.
There is a caveat built into the index itself. Technology now makes up roughly a third of the S&P 500, far more than in 1929 or 1973, so a sell-off led by tech shares moves the headline index more than an equivalent episode would have in earlier decades.
Chips have already matched their Covid-era fall
The headline index may look calm, but semiconductor stocks have dropped as far in this episode as they did at the start of the pandemic. Comparing each index's current distance from its record with the low points of its own historic declines, Kadoa finds the chip index's 36% fall over roughly four and a half months sits level with its 2020 crash and well beyond anything the S&P 500 or Nasdaq have experienced this time.
Past recoveries sometimes took decades
Kadoa also measured how long each index needed to close back at or above its record after earlier crashes, using prices only:
- Great Depression: 25 years for the S&P 500.
- 1973 oil shock: 7.5 years for the S&P 500, 5.7 years for the Nasdaq.
- 1987 crash: 1.9 years for both the S&P 500 and the Nasdaq.
- Dot-com bust: 7.2 years for the S&P 500, 15.1 years for the Nasdaq and 17.7 years for chip stocks. Because the Nasdaq and the chip index had still not reclaimed their 2000 highs by 2008, Kadoa counts the financial crisis as part of that same dot-com drawdown for those two indexes.
- 2008 crisis: 5.5 years for the S&P 500.
- Covid: six months for the S&P 500, three and a half months for the Nasdaq and chips.
- 2022: about two years for all three indexes.
- April 2025: four months for the S&P 500, 6.5 months for the Nasdaq, 1.2 years for chips.
For the current slide, the clock is still running: about one month for the S&P 500 and Nasdaq, four and a half months for chips.
These are worst-case figures for an investor who bought exactly at the peak; with dividends reinvested, Kadoa says most recoveries were shorter. The S&P 500 series is the price index built from daily closes on Yahoo Finance, with the S&P 90 standing in as its predecessor before March 1957. The firm notes that "AI sell-off" is its own label for the slide that began at the 6 October 2026 record, and that it is updating the figures daily.
Why it matters
The gap between a 6% broad-market dip and a 36% collapse in chips is the real story for anyone tracking the AI industry. Whatever is driving the sell-off, the market is concentrating the pain almost entirely in the semiconductor layer, the part of the stack most exposed to AI infrastructure spending, while the wider index has so far absorbed the shock. History cuts both ways: most 6% dips stay shallow and several recent recoveries took only months, but the dot-com era shows a technology-centred bust can leave narrower indexes underwater for well over a decade. Kadoa's daily updates make the tracker a useful reference point as the episode either stabilises or deepens.
- #ai
- #stock-market
- #semiconductors
- #market-analysis
- #finance