· via Hacker News – Front Page (native)
Interactive drilldown dashboards served from a single Parquet file on R2
A demo by Hamilton Ulmer renders filterable analytics charts entirely in the browser from one 40MB Parquet cube on Cloudflare R2, using an 18KB reader and HTTP range requests instead of a database.
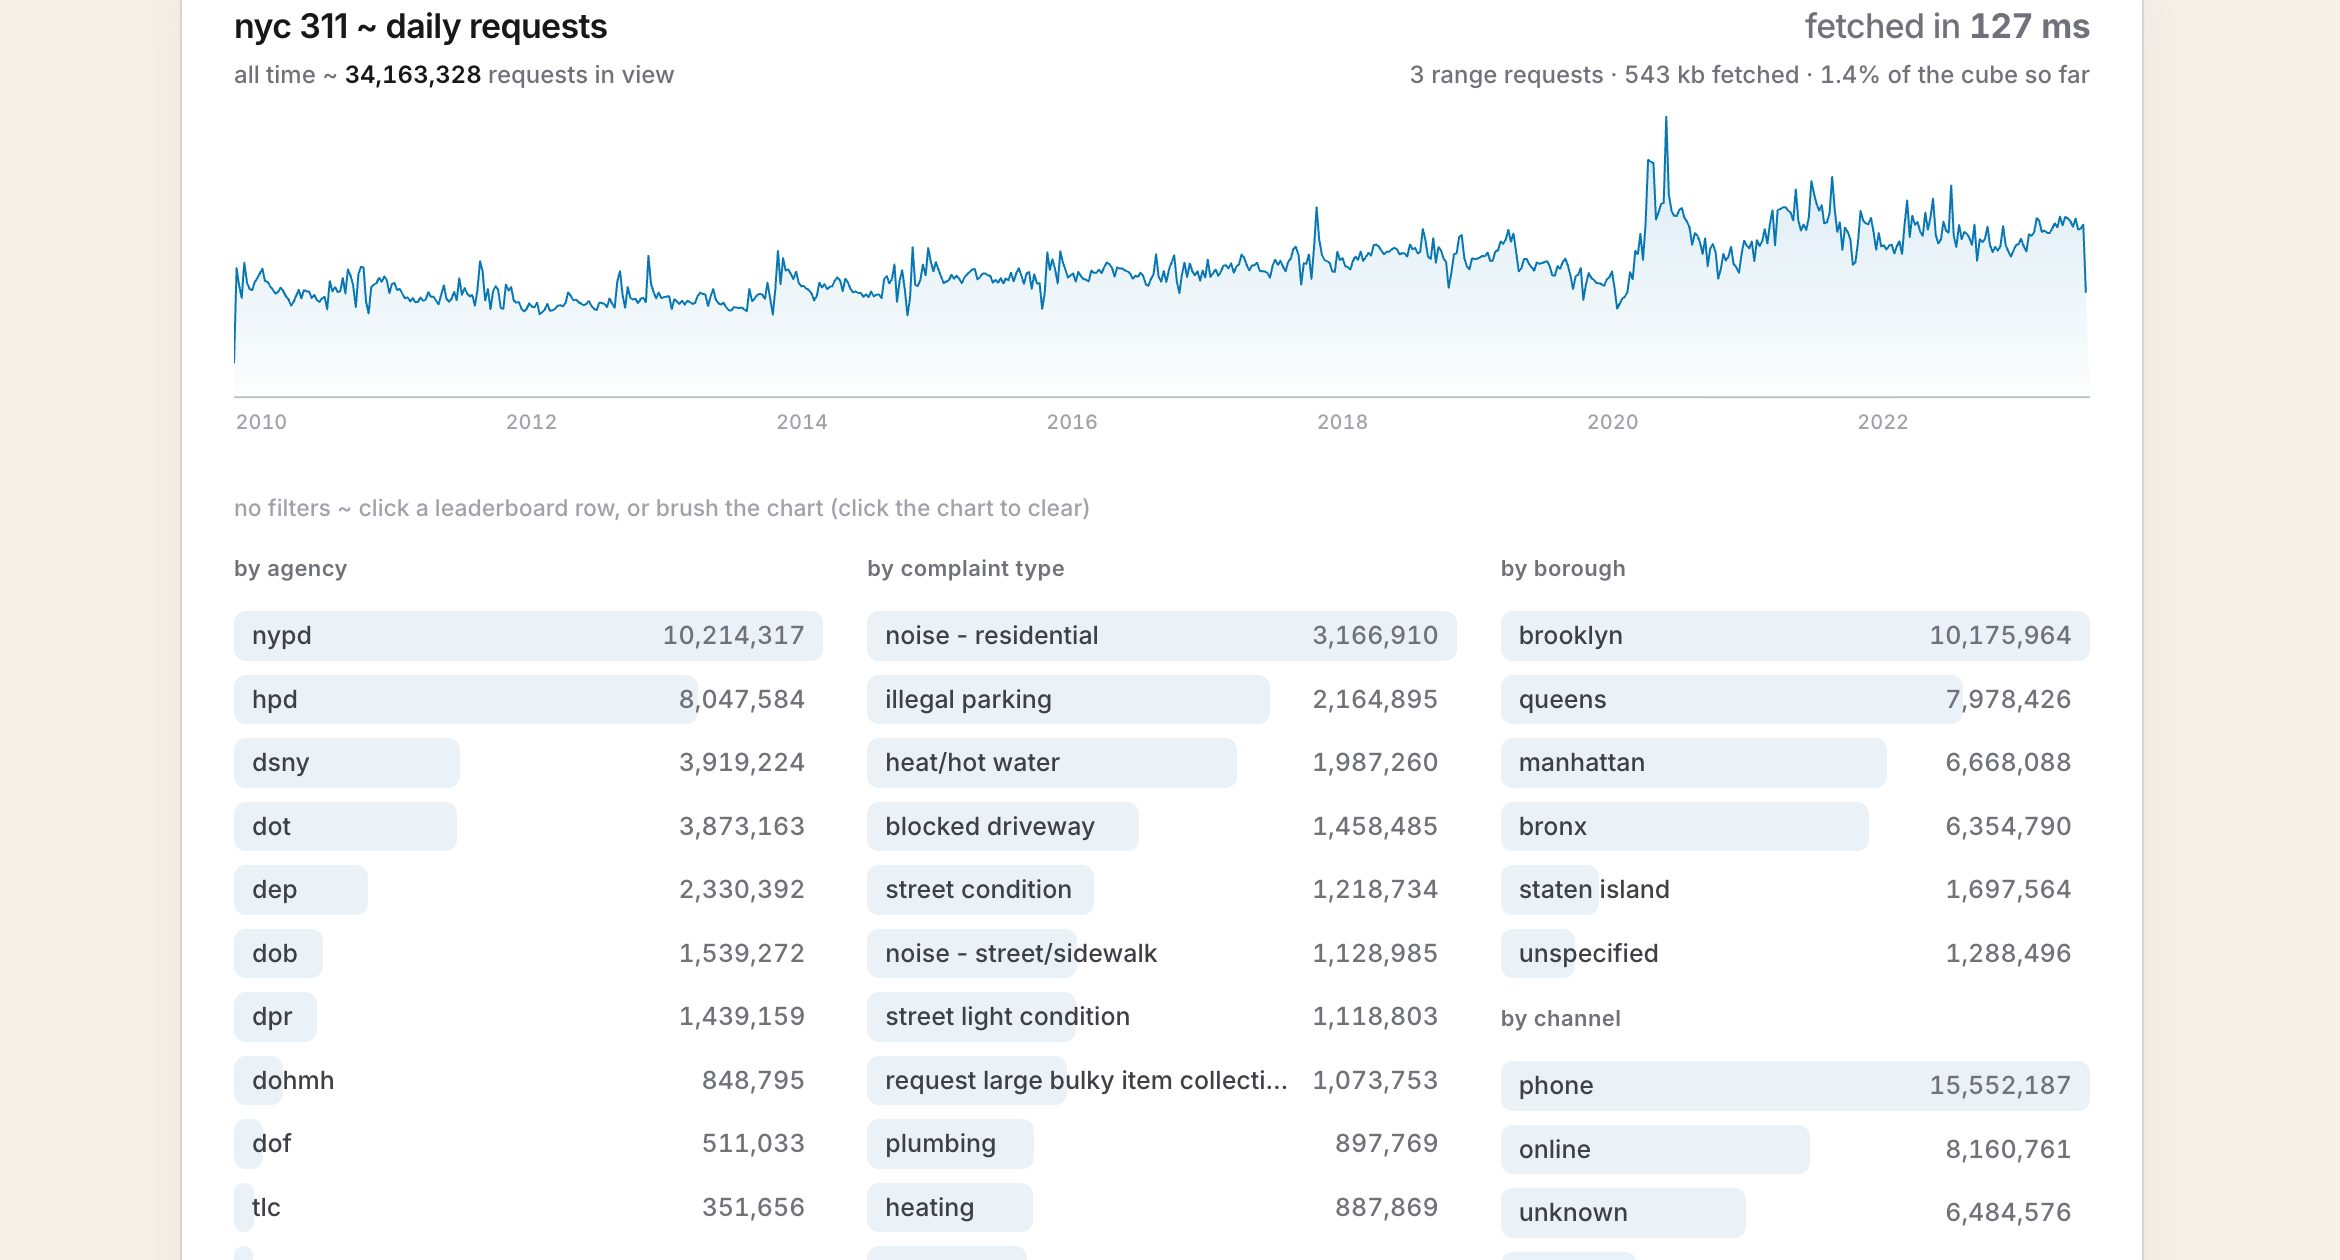
A developer demonstration published by Hamilton Ulmer shows that an interactive, filterable analytics dashboard can be served from nothing more than a single Parquet file in object storage. The setup pairs a 40MB pre-aggregated data cube hosted on Cloudflare R2 with Hyparquet, a JavaScript Parquet reader of roughly 18KB that runs in the browser, and answers every chart and filter interaction with a few HTTP range requests. There is no database, no query engine and no API server involved.
Precomputing the questions a dashboard asks
According to Ulmer's writeup, the approach works because a drilldown dashboard answers a bounded set of questions: requests per day, requests per day for one agency, all-time totals by borough. Each of those is a GROUP BY query, so instead of executing them on demand, every result is computed in advance and stored as its own small table, which he calls a grouping set. The sets are stacked into one Parquet file, one section per set.
Some sets answer questions directly — all-time totals feed the leaderboards, and daily sets for every filter combination drive the line chart. Others exist purely to reduce latency, such as weekly and yearly sets that shrink the number of rows fetched when a user brushes a date range, compared with summing daily rows.
The demo itself was built from the NYC 311 service request dataset, around 34 million rows spanning roughly 15 years, rolled up with filters for agency, complaint type, submission channel and borough, plus a time column for the series charts.
File layout is what makes it fast
Two features of the Parquet format do the heavy lifting on the read side. A Parquet file is divided into row groups, and the footer holds metadata describing each group's byte range along with the minimum and maximum values of every column inside it. The browser reads the footer once — about 195KB in this file — then uses the min/max statistics to determine which row groups could match a query, fetches only those byte ranges, and aggregates the rows locally.
Sorting is the other half of the trick. Ulmer sorted each grouping set by the columns its queries filter on, so matching rows form a contiguous stretch of the file and the statistics let the reader skip everything else. Had the rows been randomly ordered, each group's value range would span nearly the whole dataset and a query would touch most of the file anyway. With the sorted layout, clicking NYPD in the agency leaderboard pulls about 260KB out of the 40MB cube.
A small Cloudflare Worker sits in front of the bucket, proxying byte ranges and caching them at the edge. Ulmer added it because the free r2.dev URL is rate-limited, and notes the caching is safe because the file never changes once written.
Where the pattern stops working
Ulmer is explicit about the limits. The combinatorics of charts and filters have to stay small, and the pipeline has to rebuild each customer's file quickly enough to meet the update cadence. Latency is largely insensitive to the cube's size, but size still matters because one file is regenerated per customer on a schedule. Two factors dominate the footprint: time grain — the daily layout made the file roughly seven times larger than a weekly equivalent of 5.6MB — and cardinality, since complaint type alone has 485 distinct values and appears in every large section.
He also frames the experiment against a broader run of projects treating object storage as a general-purpose substrate, citing a recent writeup on managing Git repositories at scale with S3 and a write-ahead log. And he admits the bias he was testing: as a MotherDuck employee, he normally assumes DuckDB is the answer to lightweight data problems. The idea came from a friend with usage data in Iceberg on R2 who wanted to show users some basic charts without adding another vendor.
Why it matters
For the common case of customer-facing usage or billing pages — a fixed set of charts, a handful of filters, and updates on a coarse schedule rather than in real time — this is a working blueprint for analytics at close to zero marginal infrastructure cost. Computation moves into the client, an immutable file caches cleanly at the edge, and the only operational burden is the batch job that produces the cubes. Ulmer points out that in a conventional analytical database setup, that pipeline is where much of the real cost sits anyway. The pattern is not a general replacement for a query engine, but it demonstrates how far precomputation, deliberate file layout and byte-range reads can stretch a plain object store.
- #parquet
- #object-storage
- #javascript
- #data-analytics
- #dashboards