· via Hacker News – Front Page (native)
OpenTelemetry guide: building products that export telemetry to any backend
A guide on the OpenTelemetry blog lays out how vendors of self-hosted software and SaaS platforms can let users push logs, traces and metrics to any OTLP-compatible observability backend.
A playbook for vendor-neutral telemetry
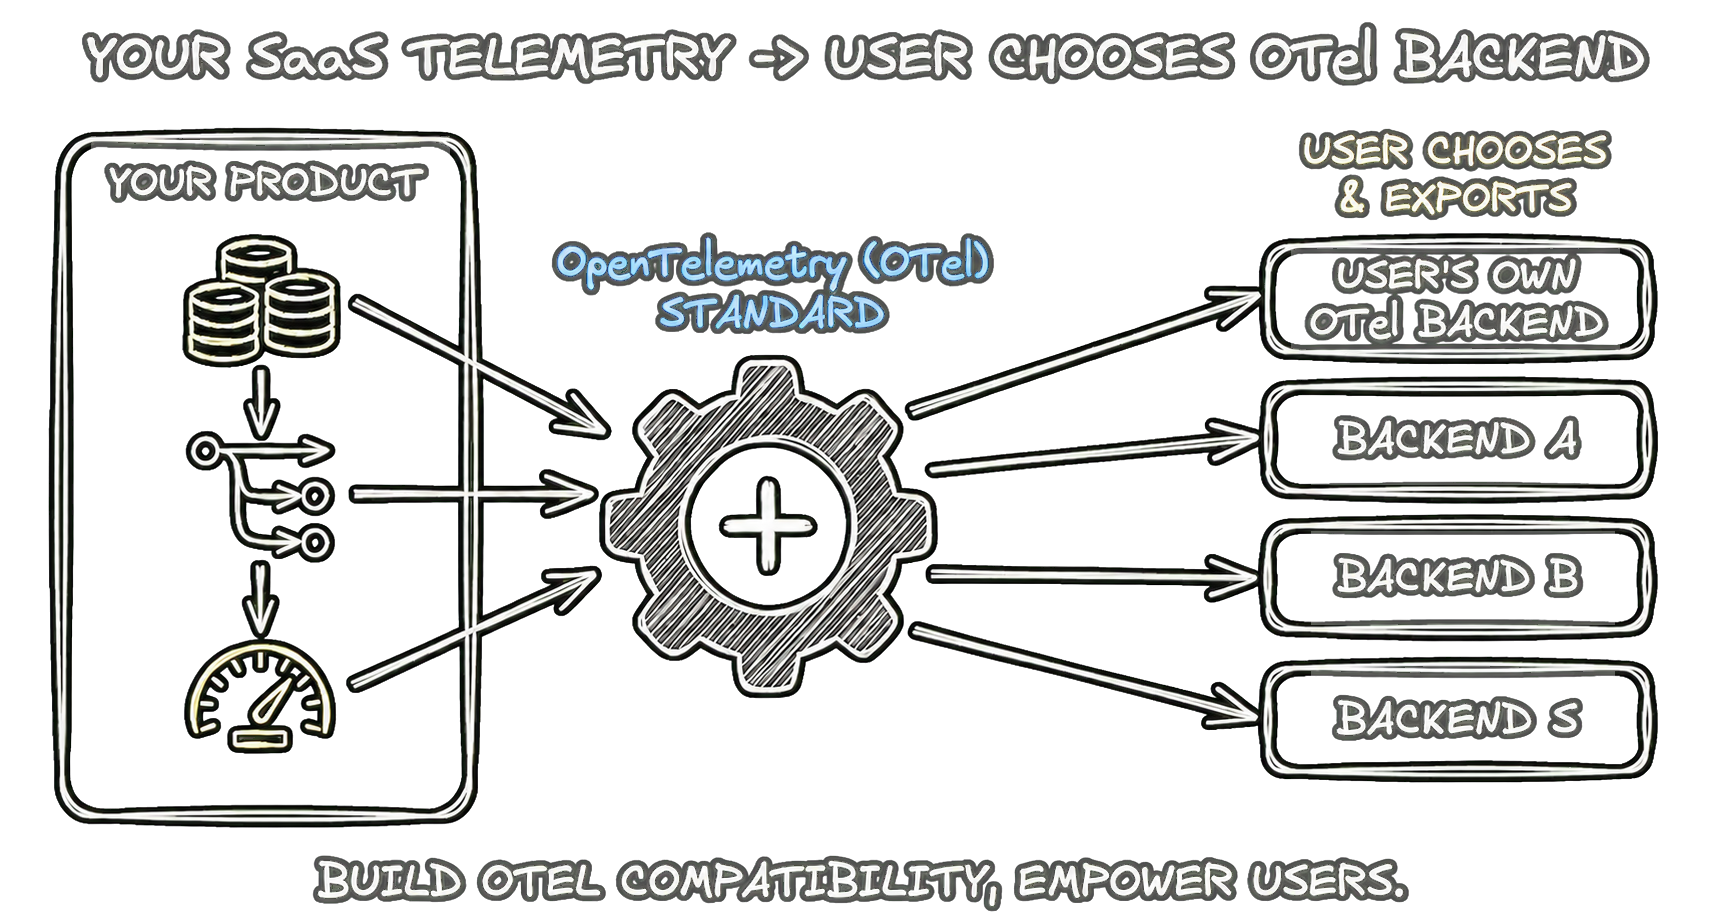
A guide published on the OpenTelemetry blog, which surfaced on Hacker News, sets out how vendors of self-hosted software and SaaS products should design their systems so customers can send logs, traces and metrics to the observability backend of their choice. Written with contributions from Dan Gomez Blanco of New Relic, the post argues that confining users to built-in dashboards, or restricting exports to a few vendors, creates avoidable friction. According to the post, customers ask to route telemetry elsewhere for recurring reasons: compliance, cost control, and keeping all observability data in one place.
Four signals, one protocol
OpenTelemetry defines four signal types, all carried over the OpenTelemetry Protocol (OTLP). Logs cover event records, access logs and application logs with timestamps and metadata; traces provide distributed spans so request flows across services stay visible and can be correlated with logs; metrics are counters, gauges and histograms such as request rates, latency and error rates; and profiles are samples showing where an application consumes resources during execution.
The export pattern is the same for logs, traces and metrics: let the user configure an OTLP endpoint and push telemetry to it. Vendors can support a subset of signals, but the post notes that most platforms already handle traces and logs, that metrics support is spreading, and that planning for all three from the start avoids retrofitting later.
What good export design looks like
The guide lists four properties of a well-designed telemetry system for every signal it emits:
- Vendor-neutral: users point at any OTLP-compatible destination, whether an OpenTelemetry Collector instance or a backend that speaks the protocol directly, with no per-vendor integrations to build.
- Standard integration: external platforms and user tooling connect through ordinary OTel SDKs and OTLP rather than proprietary APIs.
- Context preserved: exported data keeps metadata, timestamps and trace/span correlation, so log records stay linked to trace IDs and remain useful in the user's own backend.
- Semantic Conventions: following the project's conventions keeps attribute names standardised and interpretable by any compatible backend, sparing users from learning vendor-specific schemas.
Two deployment contexts decide the approach
The right architecture depends on who operates the system that produces the telemetry.
For self-hosted software — an identity server, service mesh or database that customers install in their own data centre, cloud account or Kubernetes cluster — the vendor instruments the product with OpenTelemetry and exposes configuration for an OTLP endpoint, typically via environment variables or a config file. Export then runs inside the customer's process. Because OpenTelemetry defines standard configuration options, the setup experience matches any other instrumented system the customer already runs. Kuma and Keycloak are the post's examples.
For cloud platforms, where workloads run on the vendor's infrastructure, the recommendation is a platform-level feature, akin to configurable telemetry destinations, through which customers declare where their data should go. The platform gathers telemetry from customer workloads and from its own services, such as routers, and forwards it to the customer's endpoint. Heroku and Cloudflare illustrate this pattern.
How four products do it
Kuma ships ready to emit logs, traces and metrics, with customers configuring export through separate mesh policies: MeshAccessLog routes access logs to a Collector along with attributes such as mesh name, MeshTrace governs distributed traces with configurable sampling and tagging, and MeshMetric exposes control- and data-plane metrics, integrating with OpenTelemetry and Prometheus.
Keycloak handles export from the process itself, with no sidecar required. Users pass a startup flag such as --telemetry-endpoint pointing at their Collector, optionally with headers and a protocol choice of gRPC or HTTP, and toggle signals individually. Tracing covers HTTP requests, database calls, LDAP and outbound HTTP and identity-provider traffic; metrics ride the same integration; and log export is in preview, off by default behind feature flags.
On the platform side, the post's comparison table shows Cloudflare Workers exporting logs and traces but not yet metrics, while Heroku supports all three signals, with users choosing among them through a --signals option. For further examples, the post points to the OpenTelemetry Integrations page, which lists libraries and services offering native instrumentation or first-class plugins.
Why it matters
Telemetry portability is quietly becoming table stakes for infrastructure software. Buyers who already operate a monitoring stack treat lock-in on observability data as a defect, and retrofitting OTLP support after years of proprietary dashboards costs far more than instrumenting early. The guide's core lesson is that this is mostly architectural discipline — standard signals, standard configuration, standard conventions — rather than bespoke integration engineering, and the same discipline serves both a downloadable binary and a managed platform.
- #opentelemetry
- #observability
- #otlp
- #telemetry
- #devops