· via Hacker News – Front Page (native)
POSETTE benchmark: local NVMe ran a 3.3-billion-row Postgres workload 9.2x faster than baseline EBS
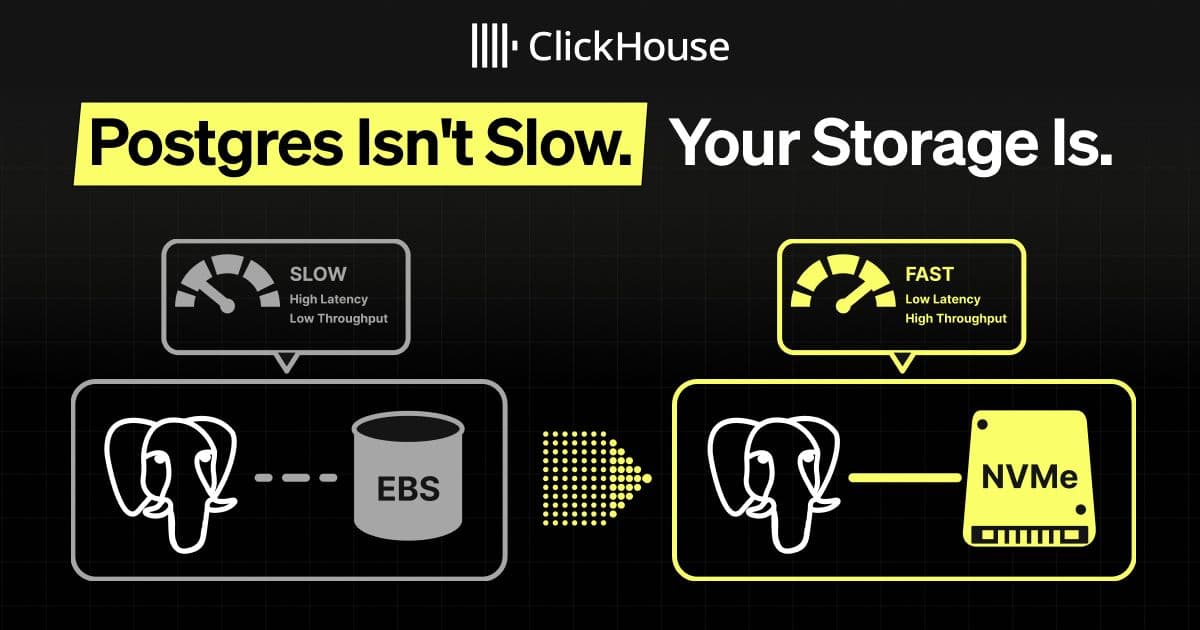
A POSETTE 2026 talk recapped by ClickHouse benchmarked a 3.3-billion-row Postgres workload on local NVMe against baseline gp3 EBS and found a 9.24x throughput gap. It also sketched a production architecture for NVMe-backed Postgres.
A familiar set of failures, one shared cause
At POSETTE 2026, Sai Srirampur gave a talk titled "Postgres Isn't Slow. Your Storage Is.", arguing that a cluster of seemingly unrelated PostgreSQL problems at scale often trace back to a single layer: the storage underneath the database. A recap published by ClickHouse walks through the benchmark behind the claim and the production architecture built on top of it.
According to the recap, the symptoms appear once a workload reaches hundreds of gigabytes or terabytes with real concurrency: ingestion pipelines heavy on UPDATEs and UPSERTs stretch from seconds to minutes; most queries stay fast while P95 latency jumps from milliseconds to seconds; autovacuum falls behind and bloat accumulates; checkpoints begin competing with client traffic for I/O and CPU; and logical replication to systems such as Kafka or ClickHouse builds lag as WAL decoding slows.
The connecting thread is that once the working set outgrows both the database's memory and the operating-system page cache, more reads become physical I/O. Meanwhile, heap and index writes, WAL synchronization, checkpoints, vacuum, and logical-decoding spills all draw from the same pool of bandwidth, IOPS, and queue capacity. When storage hits one of those limits, operations start delaying each other, which is how one slow layer can produce several apparently unrelated problems.
The benchmark setup
To isolate storage as the only variable, the test used eight otherwise identical PostgreSQL clusters: four on instance-store NVMe and four on baseline gp3 EBS provisioned at 3,000 IOPS. Each cluster ran on an m6id.4xlarge instance with 16 vCPUs, 64 GiB of RAM, and 16 GiB of shared_buffers, against a 482 GiB pgbench_accounts heap holding 3.3 billion rows. Every cluster then executed the same highly concurrent random-UPDATE workload for five minutes, with 64 clients and 16 worker threads.
What the numbers showed
The NVMe clusters reached a median of 16,030 transactions per second, versus 1,734 TPS on EBS, a 9.24x difference in this test. Median transaction latency fell from 36.9 ms to 4.0 ms. The gap extended to background work as well: a VACUUM over 10 GB of bloat finished in 366 seconds on NVMe versus 964 seconds on EBS, and a 10 GB logical-replication backlog drained in 139 seconds instead of 238.
A breakdown of the EBS transaction latency explains where the time went. Page reads accounted for roughly 19 ms on EBS versus 0.3 ms on NVMe, WAL fsync at commit added about 11 ms versus 1.5 ms, and lock and scheduler overhead contributed around 5 ms versus 0.2 ms. CPU work itself was nearly identical, about 2 ms in both cases. The database was not doing more work on EBS; it was spending most of the extra time waiting on storage.
Two further observations support the same conclusion. A mid-run pg_stat_activity snapshot showed 29 of 64 backends on EBS waiting on IO:DataFileRead versus 9 on NVMe, roughly 45 percent against 14, though the recap notes this is a point-in-time sample rather than a run average. Over a roughly 240-second profiling window, the NVMe host accumulated 2,253 CPU-seconds (about 9.4 busy cores) while the EBS host accumulated only 251 (about one core): EBS backends were mostly parked off-CPU waiting for storage, while NVMe kept its cores busy with useful work.
The recap is explicit about the limits of the comparison: the results apply to this workload and these configurations, and the EBS side used baseline gp3 at 3,000 IOPS. A differently provisioned EBS setup would most likely produce different numbers.
Making ephemeral storage production-safe
The obvious objection to local NVMe is that instance-store volumes are tied to the machine: data disappears with the node, the volumes cannot be snapshotted through the EBS API, and capacity depends on the instance type. The talk's answer is to provide durability at the cluster level rather than on any individual node, with three requirements:
- Replication that survives node loss, using quorum-based synchronous replication with two standby candidates. With a configuration such as ANY 1 (standby1, standby2), a transaction commits once either standby durably acknowledges its WAL rather than waiting for the slower one, and nodes sit across availability zones to withstand an AZ failure.
- Backups and recovery data held outside the database machines, for example with the open-source WAL-G tool providing physical base backups and continuous WAL archiving.
- Capacity planning around the NVMe available on each instance type.
Why it matters
The benchmark gives quantitative backing to what many operations teams suspect: when PostgreSQL degrades at scale, the engine is often waiting rather than working, and the storage class is the biggest lever available. The latency decomposition, splitting page reads, WAL syncs, scheduler overhead, and CPU time, is also a transferable diagnostic technique for anyone chasing unexplained tail latency. And the proposed architecture shows that the main drawback of local NVMe, its ephemerality, can be engineered around with synchronous replication plus off-node backups. The gp3 caveat cuts both ways: baseline network storage is close to a worst case, so the 9.24x figure should be read as the size of the opportunity rather than a universal constant.
- #postgresql
- #storage
- #benchmarks
- #cloud
- #database-performance