· via Vercel blog
Vercel Sandbox adds memory usage metrics to dashboard and CLI
Vercel Sandbox observability now includes memory usage data, with average, P75 and P95 figures in the dashboard and a new CLI metric that supports custom queries and alerts.
Vercel Sandbox gains memory observability
Vercel has added memory usage metrics to its Sandbox observability suite. According to a changelog post dated September 25, 2026, the data is surfaced in two places: the Vercel dashboard and the Vercel CLI, giving teams visibility into how much memory their sandboxes actually consume instead of leaving them to infer it from workload behaviour.
What the dashboard shows
The centerpiece is a Memory Usage card that joins the existing CPU usage and data transfer panels on the sandbox overview page as well as the project- and team-level pages. It reports average, P75 and P95 memory across sandboxes, plotted over time — enough to distinguish steady-state consumption from tail spikes.
For an individual sandbox, Vercel tuned the detail-page charts around a specific question: how close is this sandbox to running out of memory? The y-axis scales automatically to the sandbox's memory limit, and a dashed reference line sits at 85% of that limit, so sustained pressure near the cap is visible at a glance rather than buried in raw numbers.
The metric is also wired into the Observability query builder as the memoryUsedBytes measure on the sandbox usage event. From the chart, users can construct custom queries and set up alerts, which opens the door to automated responses when memory consumption climbs.
Access from the CLI
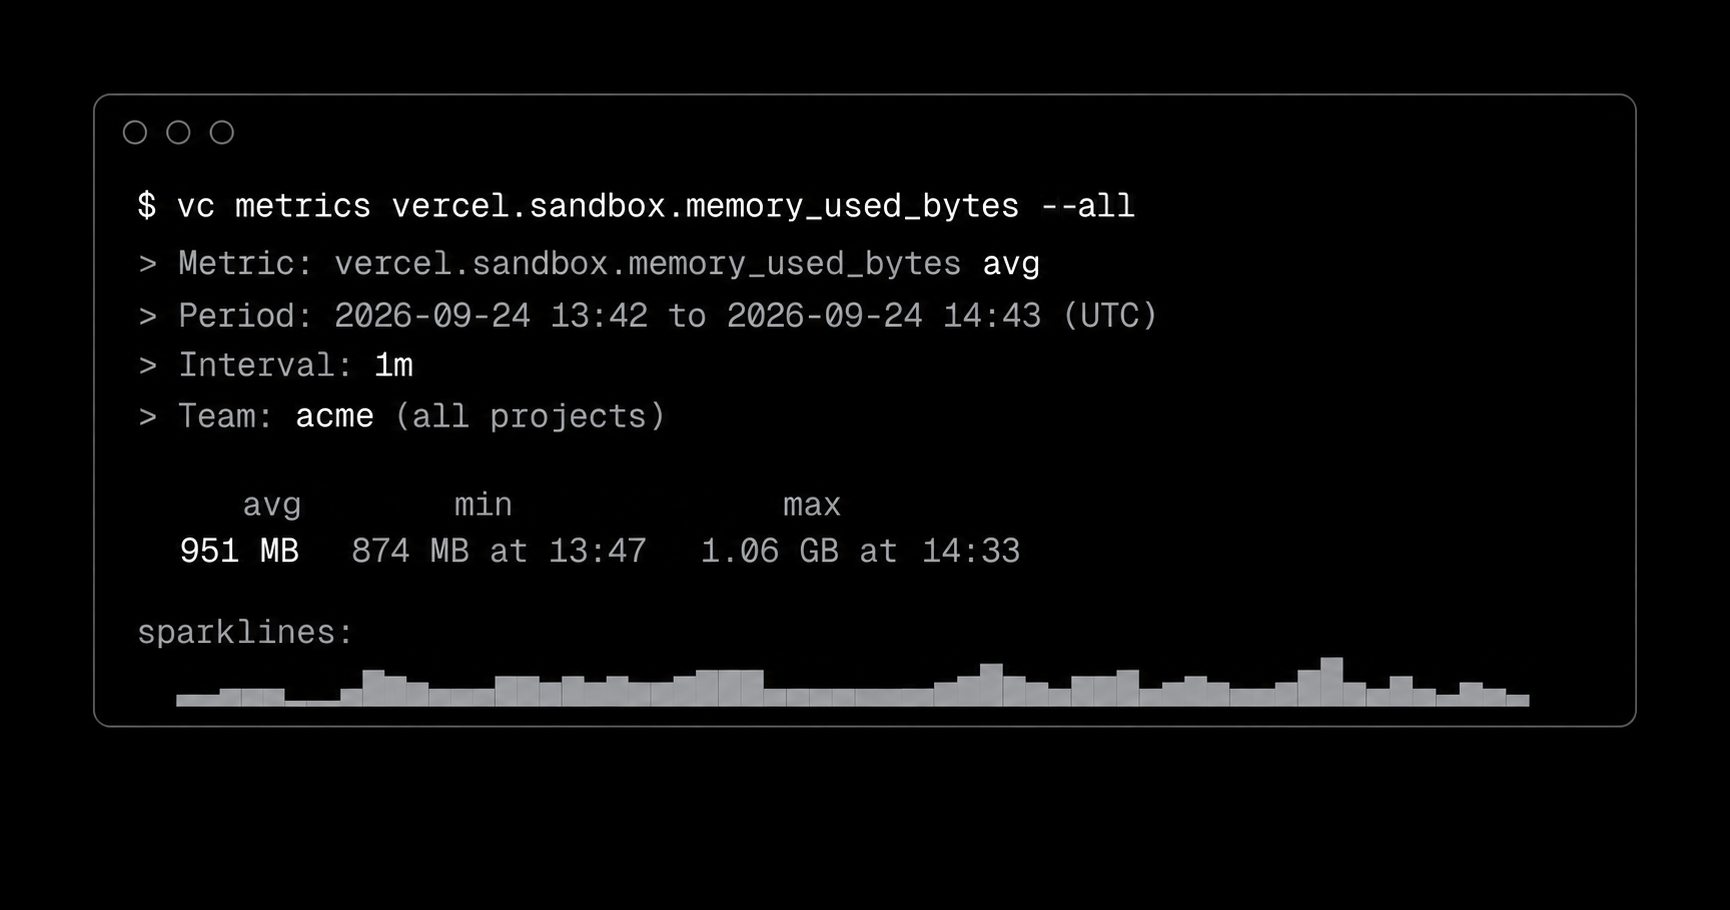
The same data is available in the terminal through the vercel metrics command, under the metric key vercel.sandbox.memory_used_bytes. Run inside a linked project, the command returns figures scoped to that project; appending --all aggregates the numbers across all projects in the team.
Per the changelog, the CLI output lists the metric itself, the reporting period, the measurement interval and the project each sandbox belongs to, alongside a graph of memory usage annotated with minimum, maximum and average values.
Why it matters
CPU usage and data transfer were already observable for sandboxes; memory was not. For sandboxed workloads with unpredictable allocation patterns — cases where memory is frequently the resource that decides whether a job finishes or falls over — that gap left operators troubleshooting after the fact with little evidence.
Three details make this more than a cosmetic addition. The auto-scaled y-axis and the 85% reference line turn an abstract memory limit into an operational signal you can read in a second. The query-builder integration with alerts means the metric can drive workflows rather than idle curiosity. And exposing the same data in the CLI under a stable metric name, vercel.sandbox.memory_used_bytes, keeps parity between the dashboard and command-line tooling, which matters for teams that script their operations or pipe metrics into other systems.
The feature is available now, with further details in the Sandbox documentation referenced by the changelog.
- #vercel
- #observability
- #cloud
- #developer-tools
- #metrics